Jui-Te Lin, Minoru Shinohara
School of Applied Physiology, Georgia Institute of Technology, Atlanta, GA
ABSTRACT
Many factors influence the extent to which manual wheelchairs meet the needs of manual wheelchair users. From a mechanical design standpoint, wheelchair performance depends on configurations and parameters that impact wheelchair propulsion. This pilot study analyzes how wheelchair configuration affects the propulsion efficiency of wheelchair use and measures muscle activity, heart rate, and kinetic energy of participants using wheelchairs of various configurations during free-wheeling. The preliminary results indicate that the rear axle design requires more effort than the front axle design, which generates less kinetic energy (KE) but requires higher metabolic cost. However, we noted no consistent pattern between wheel types resulting from the turning properties of free-wheeling. Because wheelchair users want the most efficient wheelchair and need to select one that works best for their needs, the method of this study is useful to qualify the difference in propulsion efficiency between wheelchair configurations.
BACKGROUND
The ease of wheelchair maneuverability influences the wheel mobility and thus the quality of life. Wheelchair configurations on mechanical characteristics are related to the maneuverability of the wheelchair. Previous studies have provided basic information on rolling resistance as a function of tire type and wheel size (Kauzlarich & Thacker, 1985) as well as the biomechanics of wheelchair propulsion (van der Woude et al., 1988). These studies have collectively led to several suggestions to improve propulsion efficiency by 1) using long and smooth propulsion strokes, 2) moving the axle position as front as is safe, 3) using larger wheel diameters for achieving less rolling resistance, and 4) using pneumatic tires that offer lower rolling resistance than solid tires when properly inflated. However, the current limitation is that the potential influence of these mechanical characteristics on propulsion efficiency has been suggested, but evidence has been limited to measure expected propulsion efficiency.
In attempts to distinguish propulsion effort of configurations, the use of a straight steady-state propulsion achieved over a track/treadmill/roller system is common to most wheelchair studies (Bednarczyk & Sanderson, 1995; Boninger, Cooper, Shimada, & Rudy, 1998; Kauzlarich & Thacker, 1985; Koontz et al., 2005; van der Linden, Valent, Veeger, & van der Woude, 1996) . Although calculating metabolic effort, such as oxygen consumption (VO2) and heart rate (HR), with long bouts of steady-state propulsion is appropriate to assess work effort, the research design in steady-state propulsion may result in some limitations. One limitation is that long durations of propulsion do not reflect actual use in the daily living. By analyzing over 29,000 bouts of mobility over 28 wheelchairs users, approximately 63% of bouts are shorter than 30s and 13m, and slower than 0.5m/s (Sharon Eve Sonenblum, Stephen Sprigle, & Lopez, 2012). Another limitation is that steady-state propulsion does not include the effect of inertia and the energy required to set an object in motion. These changes in momentum include starting, changing speed, turning, and stopping. Since these inertial changes dominate actual wheelchair use, methodologies that study only steady-state may not represent everyday mobility. In addition, instrumented wheels will alter the mass and the inertia of the system. As a result, the change in system energy will affect the external validity of measuring propulsion efficiency (Sprigle, 2009).
The objective of this study is to develop a systematic method of measuring and analyzing the metabolic and neuromuscular efforts of test subjects, and the resulting kinetic energy (KE) of the occupied wheelchair during free-wheeling. This technique would also be used to see if expected differences in propulsion efficiency are observable during a variety of motions that represent natural mobility.
METHOD
Subjects
This pilot study recruited five subjects: four able-bodied individuals and one experienced manual wheelchair user with reflex dystrophy. Three subjects were males and two were females. The age ranged from 25 to 33 years old.
Instrumentation
Neuromuscular responses. This study used a bipolar EMG recording system (Noraxon TeleMyo 2400T G2, USA) to quantify neuromuscular activity in the triceps, the pectoralis major, the anterior deltoid, and the biceps brachii of the dominant side. These muscles were selected as the majorly propulsion muscles in different push phases (Louis & Gorce, 2010; Qi, Wakeling, Grange, & Ferguson-Pell, 2012) .
Metabolic responses. During physical activity, metabolic demand is reflected by the heart rate (HR). The subjects’ heart rate were recorded by a heart rate monitor (Polar RS400, POLAR, Finland) attached to the subjects’ chests during the wheelchair propulsion task.
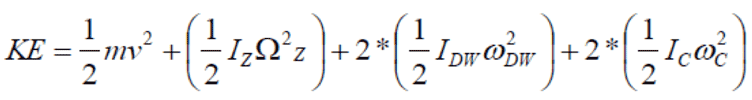
Wheelchair Kinetic Energy (KE).KE was measured by a kinetic measurement system that included two small axle-mounted encoders on both wheels and a data recording system (LabJack U6, USA) below the wheelchair seat. Prior to the KE measurements, complete wheelchair systems and individual wheelchair components, which include an occupied wheelchair, wheels and casters, underwent testing to measure their respective mass, mass distribution, and mass moments of inertia. An iMachine has been designed and validated for this purpose (Eicholtz, Caspall, Dao, Sprigle, & Ferri, 2012). The KE was calculated by the following simplified equation:
 |
|---|
where KE is the total kinetic energy, m is the mass of the occupied wheelchair, v is the speed of the occupied wheelchair, I is the moment of inertia of the occupied wheelchair (z), drive wheels (dw), and casters (c), w is the rotation rate of the drive wheels and casters and is the yaw rate of the occupied wheelchair.
Procedures
To examine the effect of wheelchair configuration, we had subjects use K0005 class Aero Z series wheelchairs (TiLite, USA). Four configurations of wheelchairs with wheel types varied between 24” mag (solid tire, 2.34 kg each) and 24” spoke wheels (pneumatic tire, 1.84 kg each), and axle positions varied between front and rear positions (4.5 cm difference). In this study, each subject propelled one configuration of wheelchairs along a slalom course at a self-selected maximum speed for five passes. The slalom course had nine colored cones on a 2m wide and 16.5m corridor. The course was aligned in a straight line, and the colored cones were set 2.5m, 2m, 1.5m, and 1m apart (Figure 1). The subjects propelled the wheelchair forward, made turns at each colored cone and then returned. After finishing five passes with one configuration, the subjects rested for 15-20 min (back to resting HR) before performing the task with the next configuration. To reduce the order effect, the test required each subject to complete the slalom course in a randomized order of configurations.
Data Analysis
EMG signals were high-pass filtered at 20 Hz, full-wave rectified, and low-pass filtered at 5 Hz yielding a linear envelope (Louis & Gorce, 2010). To reduce the variability in data across muscles and subjects, the EMG envelope was normalized by maximum static propulsion effort (MSPE) and represented as a percentage. To reduce the impact of learning (first pass) and fatigue (after two passes), the normalized EMG in each muscle was later averaged for the duration of the second pass and normalized by the mean velocity. The HR was averaged for the last 15s and normalized by the mean velocity. KE was calculated as described in Equation 1. KE included the features of the different component mass, velocity, and inertia. The time-series KE was low-pass filtered at 2 Hz. To process all of these data, this study used custom-made software (Matlab 2011, MathWorks, USA).
RESULTS
Only the tendency and the comparison of mean values are described below on the preliminary results. For physiological effort during the slalom course, the normalized HR was high at rear axle with mag and spoke wheels (Table 1). The result further illustrated that subjects’ HR were higher with the spoke wheels than with the mag wheels at rear axle (Table 1). However, no other obvious difference was noted between the mag wheels and the spoke wheels at the front axle (Table 1).
|
FM |
FS |
RM |
RS |
HR |
146.36±30.5 |
148.20±29.59 |
157.92±19.62 |
168.22±13.14 |
KE |
0.09±0.07 |
0.10±0.05 |
0.08±0.05 |
0.08±0.04 |
ME |
6.45±4.01 |
7.14±2.76 |
6.22±1.94 |
5.58±1.48 |
| Note: HR (bpm/speed) = heart rate; KE (J) = kinetic energy; ME (KE/HR, J/bpm) = metabolic efficiency; FM = front axle, mag wheels; FS = front axle, spoke wheels; RM = rear axle, mag wheels; RS = rear axle, spoke wheels. | ||||
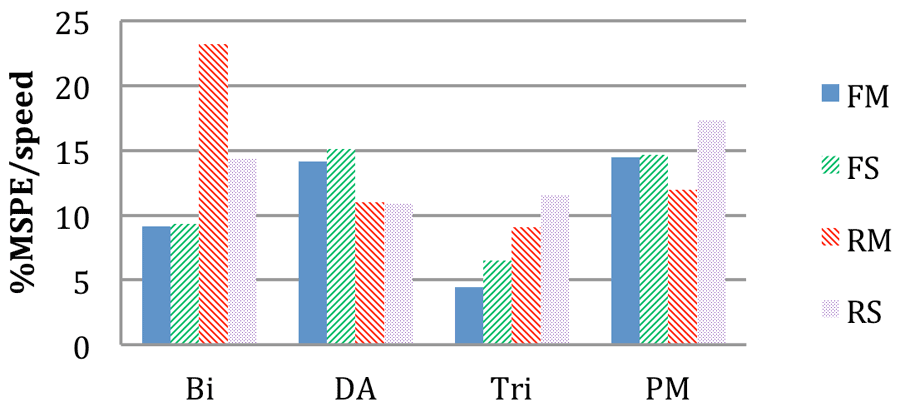 Figure 2. Normalized neuromuscular activities over different muscles and configurations. Note. MSPE = maximum static propulsion effort; Bi = biceps brachii; DA = deltoid Anterior; Tri = triceps; PM = pectoralis major.
Consistent with HR, the normalized EMG of the biceps and the triceps were high at the rear axle configuration with the mag and spoke wheels. In contrast, subjects used higher muscle activity in the deltoid anterior with the front axle than with the rear axle. Although the effort expended by the pectoris major was the highest with the rear axle with the spoke wheels, the pectoris major was the lowest with the rear axle configuration with the mag wheels. While propelling with different wheel types, they used higher muscle activity in the triceps with the spoke wheels than the mag wheels across axle positions. While propelling with the rear axle, muscle activities in the biceps was higher but the pectoralis major was lower with the mag wheels than the spoke wheels. However, no obvious difference appeared when they used the biceps and the pectoralis major with the wheel types with the front axle. Muscle in the Deltoid anterior was slightly higher with the spoke wheels than the mag wheels at the front axle. However, no obvious difference appeared when they used the deltoid anterior between wheel types with the rear axle (Figure 2).
KE represents the energy output of occupied wheelchairs. As expected, KE was the highest in the front axle configuration with the spoke wheels (Table 1). However, no obvious difference was observed in other configurations.
Metabolic efficiency was yielded as the ratio of KE output to metabolic effort (HR). KE/HR was the highest in the front axle configuration with the spoke wheels (Table 1). In contrast, the lowest ratio was noted in the rear axle configuration with the spoke wheels. Use of the mag wheels in both axle positions exhibited no obvious difference.
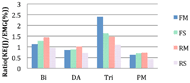 Figure 3. Neuromuscular efficiency over different muscles and configurations. Note. Bi = biceps brachii; DA = deltoid anterior; Tri = triceps; PM = pectoralis major
Neuromuscular efficiency was assessed by taking the ratio of KE output to neuromuscular effort. Neuromuscular efficiency in all of the muscles was the lowest with the rear axle configuration with the spoke wheels. Neuromuscular efficiency in all the muscles except for the triceps was the highest at the rear axle with the mag wheels (Figure 3). In addition, no obvious difference between uses of wheel types in the front axle configuration was observed in the deltoid anterior nor between the front axle with the spoke wheels and the rear axle with the mag wheels in the pectoralis major.
DISCUSSION
This pilot study supports that wheelchair configuration is associated with mechanical efficiency. In addition, it is well designed to examine free-wheeling activity by testing the relationship between physiological effort and partitioning KE. Testing the mechanical efficiency under free-wheeling activity offers the advantage of representing the natural propulsion situation, which includes several inertia-changing activities.
Compared to conventional wheelchairs, sport wheelchairs have higher propulsion efficiency (17% less oxygen consumption and 24% less HR) at a controlled constant speed (Hilbers & White, 1987). While moving axle to the rear position, wheelchair users tend to increase their number of strokes and their propulsive force but decrease their push angle to maintain the certain speed (Boninger, Baldwin, Cooper, Koontz, & Chan, 2000; Masse, Lamontagne, & O'Riain, 1992) . In addition, the axle position causes more impact on peak resultant and tangential force while they propel the wheelchair on a challenging surface (Cowan, Nash, Collinger, Koontz, & Boninger, 2009) . Louis et al. (2010) further found that front axle design generally increased muscle activation, especially during an early push phase while a user is moving straight forward at a self-selected speed (Louis & Gorce, 2010). Our measurements showed the similar result: that participant had higher HR, lower KE and lower metabolic efficiency with the rear axle than they did with the front axle. However, our measurements did not show a clear pattern in muscle activity and neuromuscular efficiency. According to our measurement, neuromuscular efficiency was less at the rear axle than at the front axle with the spoke wheels. However, only triceps had less neuromuscular efficient with the rear axle than with the front axle with the mag wheels. It is possible that propelling a heavy wheelchair (mag wheels) with a rear axle required higher muscle activity only in the triceps during the middle push phase at a low speed during a turn. In other words, propelling a heavy wheelchair with the front axle at a high-speed turning loses greater neuromuscular efficiency in the biceps, the deltoid anterior, and the pectoralis major during recovery and early push phase.
With respect to the effect of wheel types, heavy solid tires had higher rolling resistance than light pneumatic tires and underwent a larger increase in rolling resistance than pneumatic tires with increased loading (Kwarciak, Yarossi, Ramanujam, Dyson-Hudson, & Sisto, 2009). However, the addition of 5-10 kg weight to a light wheelchair did not affect the wheeling pattern under steady and slow propulsion (Bednarczyk & Sanderson, 1995). According to our measurement, we found no clear, consistent pattern that supports that spoke wheels performed better efficiency than mag wheels during free-wheeling activities. In contrast, participants had higher HR but less neuromuscular efficiency using a rear axle wheelchair with the spoke wheels than with the mag wheels. To handle the light spoke wheels during a turn, wheelchair users tend to expend extra muscle activity to decrease wheelchair movement and thus reduce their propulsion efficiency.
LIMITATIONS
The major limitations of this pilot study were its small sample size and relatively homogenous subject population. This study recruited only one wheelchair user and four able-bodied individuals. Another limitation was that all subjects used the same configuration to control the mechanical properties of their wheelchairs. However, subjects have different body parameters, which could change propulsion patterns and confound the result. In the future, increasing the sample size and controlling for confounding factors could improve the validity of the results. In addition, the KE components, such as rotation, yaw turning and translational energy should be analyzed separately for a more comprehensive analysis of propulsion efficiency. Nonetheless, this research design allows researchers to evaluate the propulsion efficiency of various wheelchair configurations under free-wheeling activities.
CONCLUSION
This research design is the first approach to directly assess the kinetic pattern and physiological response under free-wheeling activities. The measurements of this pilot study supported the expected result that wheelchair users generate less kinetic energy output but require higher metabolic cost using the rear axle configuration than they do using the front axle configuration. This research design also supported that free-wheeling activities differ from steady-state propulsion, which result in variations in neuromuscular response for further control.
REFERENCES
ACKNOWLEDGEMENTS
This study was sponsored by Mobility RERC, NIDRR. We would like to thank Phuc Dao for providing advice and assistance. We also thank Fausto Medola and Listtee Vonk for their critical feedback.